
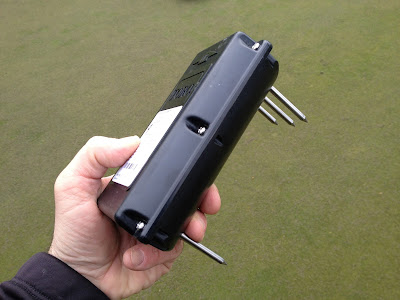
Okay these things are really neat. What I'm holding in this photo is a sensor that communicates with my office computer and is completely wireless. It senses the temperature, moisture, and salinity of soil. So as you can see by the next series of pictures, these things are buried in three of our greens and so now we can monitor growing conditions and therefore make better decisions in regard to our cultural practices (i.e. irrigation, fertility, etc.) Although I love technology, I must say I grow grass by using visual observations more than any other method to determine the turf's needs. So initially I felt this type of monitoring would not be very beneficial to me and so I never thought about making the investment. We recently purchased new irrigation software, which we did need, and that coincidentally made investing in this wireless monitoring technology much more affordable, so I decided to try them out. To my surprise, they work very well and I am very excited to see how they might assist me over the next growing season.

To install these devices, we first needed to select which greens to monitor and which area of the green to bury the device. I'm starting with just three sensors so we decided to choose three greens that had very different growing conditions so as to see the widest range of differences. In other words, I picked green #9 because it is wide open and will therefore have some of the highest soil temperatures. It is also constructed of native soil and drains rather poorly so I expect to find some of the highest moisture readings on this site. Another sensor is buried on #3 since it is one of our shadiest greens and should stay cooler on a sunny day. Number 3 green also drains very well so I expect to see some drier readings in regard to moisture. The third sensor is buried in green #18 which is kind of an "in betweener". The 18th green is shaded most of the morning but has adequate sunlight overall and decent drainage. So as you can see by the picture above, we use the same tool that we use to cut cups for making the hole to install the sensor. I chose to cut two cup holes right next to each other which gave me a little more room to get my fingers in there and push the sensor probes into the soil.


Here you can see the sensor probes are pushed into the soil and I'm backfilling the hole.

The turf plugs are then replaced.

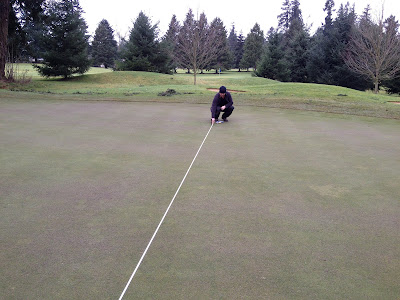
And as you can see I did a decent job of making it look like I was never there. I forgot to mention that I selected an area on each green that was close enough to the edge of the green that it is very unlikely a person would ever cut a cup there. This is important since when we cut cups, we usually thrust the cup cutter into the ground with the kind of force that would damage the sensor if it was struck with the cup cutter. Of course we also need to avoid aerifying this spot since the aerification machine would certainly destroy the sensor. So we take measurements from two fixed spots to the sensor so that we can find it in the future. For our fixed spots to measure from we chose sprinkler heads and in the next two pictures you can see how this is done.

FYI, we top-dressed the greens the morning we took these pictures so that is why the turf looks a little grey in color. So now the sensor is installed and all we need to do is set up the antennae to receive the signal. This is done inside the irrigation pedestals as you can see here.

I have direct communication with each of the irrigation pedestals but really they are only needed to provide power to work the device. All the communication is done wirelessly from the sensor to the antennae and then to a base unit in my office and then to my office computer. Okay so now we are ready to start collecting data.

Here is a picture of my computer screen and you can see that there is three sets of data. The top graph shows moisture in the three greens and as I expected the numbers are higher on our poor draining 9th green which is the center red bar. The green bars in the middle of the screen show temperature and again the center bar which is the ninth green is higher than the others since it gets much more sunlight. The bottom purple bars indicate salinity and right now it is completely irrelevant since none of the readings on any of the greens reveal a level of salinity that is alarming. Given the large amount of rainfall during the winter months, salinity will almost never be an issue. I imagine in the summer after prolonged irrigation, we might see something interesting with this data so I look forward to July and August. I also look forward to summer because I think the most useful data will be soil moisture. During the irrigation season, I expect moisture readings from these sensors will assist us in deciding when to water and how much to water, therefore providing even better more consistent conditions for the golfer. Either way we now have another tool to help us manage turf and I'm guessing this is just the tip of the iceberg. Stay in touch with the blog as there will definitely be more posts coming to show what we are learning from the sensors. This last pic shows some of the cool graphs we can display with the data. The most interesting trend so far is to see how much temperature fluctuates on the putting surface from hour to hour and day to day. Stay tuned.........

No comments:
Post a Comment